What is MTR and How to Run a Test (Windows, Linux, and Mac)
Introduction to MTR
What does MTR mean?
MTR stands for My Traceroute, a powerful network diagnostic tool that combines the functionality of both ping and traceroute. It was designed to analyze the route data packets take from your device to a destination server, helping identify potential issues in real-time.
What is the main function of MTR?
The primary function of MTR is to trace the network path between a source and a destination, while continuously measuring latency and packet loss at each hop along the way. It provides dynamic, real-time statistics that help network administrators and users diagnose where problems are occurring in the route.
Why use MTR instead of traceroute or ping?
While ping measures the round-trip time to a destination and traceroute shows the path packets take, MTR combines both functionalities. It repeatedly sends packets and updates latency and loss information in real-time, making it far more informative and practical for ongoing network troubleshooting.
How MTR works
Combination of traceroute and ping
MTR sends probe packets with incrementally increasing TTL (Time To Live) values, just like traceroute. Simultaneously, it measures the round-trip time for each probe, similar to ping. This continuous feedback loop offers a comprehensive view of each hop’s performance on the route to a target such as 8.8.8.8.
Detects packet loss and latency
As it runs, MTR collects statistics on the percentage of lost packets and the average, minimum, and maximum latencies per hop. This enables the user to spot where in the chain performance is degraded or failing altogether.
Identifies network bottlenecks
Bottlenecks in a network path can slow down traffic dramatically. By visualizing delays and inconsistencies at each hop, MTR helps identify precisely where bottlenecks or unstable routers exist between your system and destinations like 8.8.8.8.
Installing and using MTR on Linux
Checking if MTR is already installed
To see if MTR is already available on your Linux system, run the following command in the terminal:
mtr --versionIf it returns a version number, the tool is already installed. Otherwise, follow the instructions below based on your distribution.
Installing via APT (Debian/Ubuntu)
Use the following commands to install MTR on Debian-based systems like Ubuntu:
sudo apt update
sudo apt install mtr
Installing via YUM or DNF (CentOS/Fedora/RHEL)
For Red Hat-based distributions, use either yum or dnf as follows:
sudo yum install mtror
sudo dnf install mtrRunning tests: basic and advanced commands
To run a basic test to Google’s DNS server:
mtr 8.8.8.8For an advanced diagnostic report with best practices:
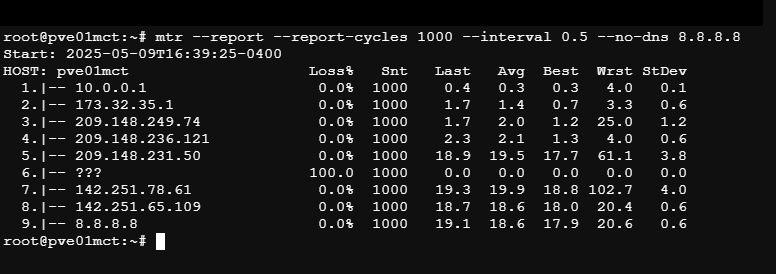
sudo mtr --report --report-cycles 1000 --interval 0.5 --no-dns 8.8.8.8This command performs 1000 test cycles with half-second intervals and disables DNS resolution to increase speed and accuracy.
Best Practices for Using MTR
Run the MTR test in both directions (source and destination)
A single MTR test from your machine to a destination (e.g., 8.8.8.8) only shows one side of the route. For complete diagnosis, run the test from the destination back to your origin as well. This helps determine whether issues are occurring on the outbound or return path—or both.
Run 1000 or more iterations per test
Short tests may not accurately reflect the real behavior of the network. Running at least 1000 cycles allows MTR to capture more reliable statistics about latency and packet loss. Use the --report-cycles 1000 option to set the iteration count.
Use the –no-dns option to disable DNS resolution
Disabling DNS lookup with --no-dns ensures faster and cleaner results by avoiding potential delays or resolution failures. You will see IP addresses instead of hostnames, which is often more helpful for troubleshooting.
Set MTR interval to 0.5 seconds or more
Using --interval 0.5 reduces the frequency of packet sends to one every half second, reducing strain on the network and making results more realistic, especially over longer test durations.
Running MTR on Windows
Alternatives to native MTR
Windows does not include MTR by default. However, a popular and reliable alternative is WinMTR, which replicates MTR’s core functions in a graphical interface.
Downloading and using WinMTR
- Visit the official WinMTR download page: https://sourceforge.net/projects/winmtr/
- Download the appropriate version (32-bit or 64-bit).
- Extract the ZIP file and run
WinMTR.exe.
Configuring the test
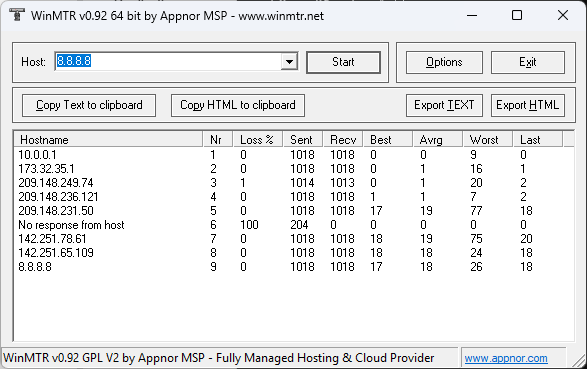
Enter the IP address 8.8.8.8 into the host field and click Start to begin the test. For best practices:
- Let it run long enough to approximate 1000 cycles.
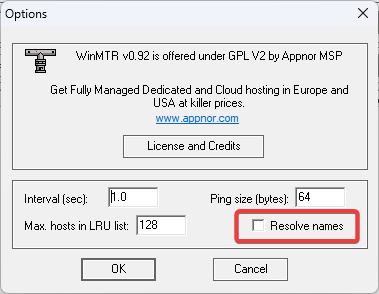
- If possible, disable DNS resolution to simulate the
--no-dnsbehavior. - Click Copy Text to Clipboard or Export Text to save results.
Interpreting results on Windows
WinMTR displays similar columns as the CLI version: Host, Loss%, Sent, Avg, Best, and Worst. Packet loss and latency patterns across hops indicate where potential issues lie.
Using MTR on macOS
Installing via Homebrew
On macOS, MTR can be easily installed via the Homebrew package manager. If you don’t have Homebrew installed, run the following in Terminal:
/bin/bash -c "$(curl -fsSL https://raw.githubusercontent.com/Homebrew/install/HEAD/install.sh)"Then install MTR with:
brew install mtrBasic and advanced commands
Run a basic test with:
mtr 8.8.8.8For best-practice diagnostics:
sudo mtr --report --report-cycles 1000 --interval 0.5 --no-dns 8.8.8.8Administrator permissions
Due to the nature of network probing, macOS usually requires admin privileges to run MTR properly. Always prefix commands with sudo to ensure complete functionality.
Tips for Apple users
- Use Terminal in administrator mode for fewer permission errors.
- Automate recurring MTR reports with shell scripts and CRON jobs if needed.
- Monitor network trends by saving reports in plain text format.
Interpreting MTR Results
Understanding columns: Host, Loss%, Snt, Last, Avg, Best, Wrst, StDev
MTR displays real-time statistics in a table format. Each column provides valuable diagnostic data:
- Host: IP address or domain of the hop.
- Loss%: Percentage of packets lost at that hop.
- Snt: Number of packets sent.
- Last: Round-trip time (ms) of the last packet.
- Avg: Average latency over all packets.
- Best: Shortest round-trip time observed.
- Wrst: Longest round-trip time recorded.
- StDev: Standard deviation — useful for identifying latency spikes.
How to identify network issues
Here’s how to detect common issues in MTR output:
- High packet loss at a specific hop: Indicates a potential failure at that router.
- High latency and large standard deviation: May indicate congestion or an overloaded node.
- Loss at the final hop: Signals possible problems with the destination server or its network.
Examples of result analysis
If you observe packet loss at the third hop but clean results afterward, it’s likely that the third router deprioritizes ICMP traffic. However, if packet loss begins at a hop and continues through to the end, that intermediate node may be contributing to network problems.
Practical Use Cases for MTR
Technical support and ISPs
Internet Service Providers and support teams use MTR to investigate and verify client complaints of slow or unstable internet. It helps isolate whether the issue lies within the user’s local network or further along the route.
Diagnosing slow internet connections
End users and businesses can use MTR to determine if slow connections are caused by internal network issues, ISP-level congestion, or a problem on the destination side. Visualizing route health hop-by-hop speeds up resolution.
Evaluating remote server stability
Server administrators regularly run MTR tests to ensure stability between their infrastructure and clients. It is especially helpful for evaluating cloud connectivity, CDN performance, and cross-country or cross-region traffic flows.
MTR and Network Security
Ethical use of the tool
MTR sends continuous probes across a network route. While this is useful for diagnostics, excessive or automated testing against third-party systems can be seen as intrusive or even malicious. Always obtain permission when testing external hosts.
Avoiding firewall blocks
Some firewalls or security appliances may drop or limit ICMP or UDP packets used by MTR. To mitigate this, test during off-peak hours and consult network security teams to allow necessary probe traffic temporarily.
Data privacy during tests
MTR itself does not transmit sensitive data—only diagnostic packets. However, in corporate environments, it’s still important to ensure compliance with internal policies and never expose internal IP architecture unnecessarily in public tests.
Advanced MTR Usage Tips
Exporting reports
For documentation or technical support purposes, MTR reports can be exported to text files. Use the following command:
mtr --report 8.8.8.8 > mtr-report.txtThis generates a one-time report with summarized statistics and saves it to a file for future review or sharing.
Running MTR continuously on servers
To monitor a connection in real-time, run MTR without the --report flag. It will continuously update its statistics on screen, ideal for identifying intermittent issues:
mtr 8.8.8.8Integrating with monitoring systems
Advanced users can integrate MTR with network monitoring tools like Zabbix, Nagios, or Prometheus using custom scripts. These integrations allow you to automatically track latency, packet loss, and network degradation across multiple targets.
Limitations of MTR
Restrictions from firewalls and proxies
Firewalls and proxies may block or rate-limit the ICMP/UDP packets used by MTR. This can result in timeouts or false indicators of packet loss. Coordinate with network security administrators to whitelist test traffic when needed.
MTR may not always show accurate routes
Some routers are configured not to respond to ICMP requests or to de-prioritize them, which can skew MTR results. It’s important to cross-reference with other tools and consider context before concluding a specific hop is problematic.
Complementary tools (iperf, smokeping)
For deeper performance analysis, use MTR alongside:
- iperf: For bandwidth and throughput testing between endpoints.
- SmokePing: For continuous latency graphing and visualization over time.
Alternative Tools to MTR
PingPlotter
PingPlotter provides a visual interface for tracing and monitoring network paths with historical data. It’s particularly useful for Windows and Mac users who prefer GUI-based diagnostics.
PathPing
PathPing is a built-in Windows utility that merges ping and traceroute with additional statistics. Though not real-time, it’s a helpful alternative for quick troubleshooting.
Traceroute++
Traceroute++ offers advanced route tracing with enhanced customization, including protocol selection and improved output readability. It’s suitable for power users and researchers.
Conclusion
Summary of MTR benefits
MTR is a comprehensive diagnostic tool that bridges the gap between ping and traceroute, offering real-time visibility into packet loss, latency, and network behavior. Its flexibility and detail make it a go-to utility for diagnosing connectivity issues on any operating system.
When and how to use it for best results
Use MTR whenever you experience unexpected connection issues or need to evaluate route performance. Always follow best practices: test both directions, use sufficient cycles, disable DNS resolution, and monitor with an appropriate interval. Combined with other tools, MTR can dramatically improve your network insight and troubleshooting accuracy.
FAQs
1. Is MTR safe to use?
Yes. MTR is safe and only transmits diagnostic probe packets. It’s widely used by network professionals. However, overuse against external networks without permission can raise alarms or violate acceptable use policies.
2. What is the difference between MTR and WinMTR?
MTR is a command-line tool available on Unix-like systems. WinMTR is a Windows-compatible version with a GUI, designed for ease of use. Both offer similar core functionalities with minor differences in format and accessibility.
3. Can I use MTR without admin permissions?
On Linux and macOS, administrative privileges (via sudo) are often required to send ICMP packets. On Windows, WinMTR may run without admin rights, but elevated permissions are recommended for complete accuracy.
4. How long does a typical MTR test last?
Basic tests may take 10–20 seconds. For more accurate results, especially with 1000+ cycles and intervals set at 0.5 seconds or higher, tests can take several minutes to complete.
5. Does MTR work over Wi-Fi?
Yes. MTR works on both wired and wireless networks. Keep in mind that Wi-Fi connections may introduce higher latency variability, so results should be interpreted with caution and preferably compared to a wired baseline.


